
Statistics
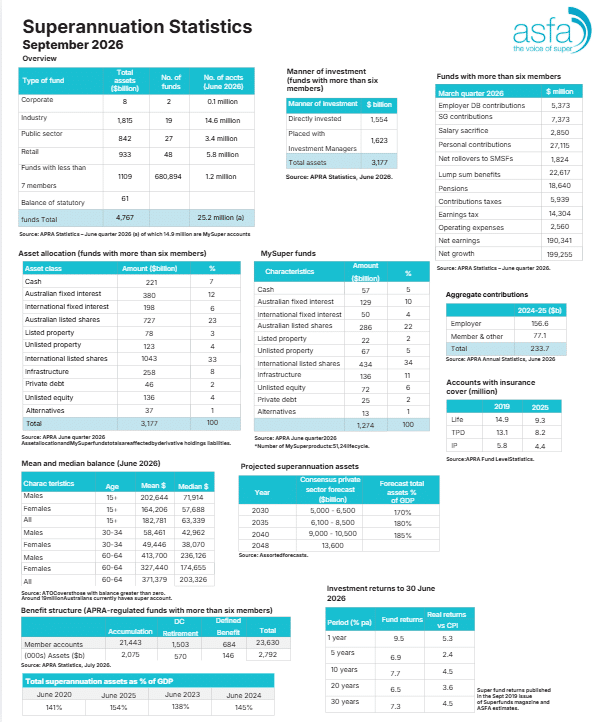
Total superannuation assets were $4.8 trillion at the end of the June 2026 quarter, declining marginally from the previous quarter.
Statistics
MySuper products had an aggregate $1,271 billion in assets, spread across 51 MySuper products as at the June 2026 quarter.
Statistics
Employer contributions totalled $46.1 billion for the quarter and $164.4 billion for the year ending in June 2026, an 9.6 per cent increase compared to the previous year. This is due to the Superannuation Guarantee (SG) rate increase, employment growth and higher wage growth.
Statistics
Member contributions were $28.1 billion for the quarter and $71.9 billion for the year ending June 2026, 21.0 per cent higher than the previous year.
Statistics
Benefit payments totalled $41.3 billion for the quarter and $148.2 billion for the year ending June 2026, a 12.1 per cent increase compared to the year to June 2025.
Statistics
The rate of return (ROR) for entities with more than six members was 8.6 per cent for the year to June 2026. The five-year average annualised ROR was 6.3 per cent.
For an overview of superannuation statistics including asset allocation, manner of investment, mean and median balances, benefit structure, assets as percentage of GDP, MySuper funds, projected assets and investment returns etc, ASFA’s Super Stats page is a convenient and informative resource.
We use cookies and similar technologies to help us understand our members' interests, improve website functionality, and provide a better online experience. By using this website, you consent to ASFA's use of these technologies. For more information about how we handle your personal information, please see our privacy policy.

Chief Operating Officer, IQ Group
Katherine Forrest is a strategic leader with over 25 years of experience in the superannuation and financial services industry. As Chief Operating Officer of IQ Group, she has played a key role in driving innovation, blending modern operational strategies with business and technology leadership. Her expertise spans project delivery, strategy, and IT management across both public and private sectors, shaping IQ Group’s consulting capabilities and redefining how clients achieve success.
A sought-after speaker on industry transformation, Katherine draws on her extensive experience to help organisations navigate change, whether through regulatory adaptation, digital transformation, or shifting consumer expectations. She has deep insights into how highly regulated industries can leverage technology and operational efficiencies to enhance customer experience, improve compliance, and drive long-term sustainability.
Katherine’s work in superannuation has also provided valuable lessons for adjacent industries, including aged care, health and retirement. As the sector faces increasing regulatory pressures, service delivery challenges, and evolving consumer demands, she shares insights from superannuation’s transformation—exploring how industry consolidation, digital innovation, and governance best practices can serve as a blueprint for aged care leaders. With a passion for driving meaningful change, Katherine translates complex industry challenges into actionable strategies, helping organisations stay ahead in an era of disruption.

Chief Policy & Advocacy Officer, ASFA
James joins the ASFA team as Head of Policy and Advocacy, bringing over a decade of public policy and political experience working with state, territory, and federal governments in various key policy and strategic roles.
Most recently, James has worked as a government engagement specialist in the Vice-Chancellor’s office at the University of Sydney and was instrumental in managing the University’s engagement with federal and NSW government, as well as advocating on reforms such as the Australian Universities Accord and the National Reconstruction Fund.
Prior to that, James worked in various roles across government and politics, including for treasurers, government leaders, and senior cabinet ministers. In advising government, James has taken leading roles in the legislative agenda of governments, and worked on reform for ministers in the transport, tertiary education, cyber security, procurement, and insurance portfolio areas.
James holds a Bachelor of International Relations from the Australian National University and holds qualifications in public policy from the London School of Economics and in Executive Leadership from the University of Oxford. He is currently undertaking a Master of Public Policy at the University of Sydney.

Risk Director – Super and Employer Obligations - ATO APRA Fund Member Reporting and Single Touch Payroll
Alastair is a Risk Director specialising in APRA Fund reported data and Single Touch Payroll. With deep expertise in regulatory reporting, data integrity and compliance frameworks. Alastair ensures that reporting entities meet their reporting obligations while maintain accuracy, transparency, and strong governance. Alastair has a strong understanding of how reported data is used within the ATO to administer programs, enabling an ability to bridge policy requirements with practical reporting solutions that support both compliance and effective program delivery.

Project Director, Superannuation and Employer Obligations, Australian Taxation Office
Shane leads the ATO’s core Payday Super initiatives, including enhancements to SuperStream, improvements to Single Touch Payroll (STP), and the retirement of the Small Business Superannuation Clearing House (SBSCH). With a strong track record in delivering complex reforms across the superannuation system, Shane brings deep technical expertise and a practical, collaborative approach. He is known for building trusted relationships across industry and government, and for bringing a personal touch to driving meaningful change.

Director, PWC
Niamh specialises in retirement benefits consulting with over 10 years experience.
Niamh has supported funds with the implementation of strategic superannuation regulatory and legislative reforms. This has included both assisting funds with implementation and performing post-implementation reviews in the areas of member outcomes, design and distribution obligations, members best financial interests, and the retirement income covenant.
Niamh has provided strategic advice on the superannuation administration market and retirement product offerings (including financial modelling of retirement outcomes).
Niamh is a qualified Actuary (FIAA) and her other work includes actuarial defined benefit liability valuation work, fund merger financial modelling for business cases, merger due diligence, SPS 250 insurance reviews and more general superannuation consulting work.
Niamh’s key defined benefit clients are state governments, with a focus on data analysis and insights, regulation review, provision of financial modelling and liability valuations.

Partner, PWC
Nathan is a retirement incomes expert having assisted Treasury with the Government’s Retirement Income Review along with numerous public policy submissions and papers on the subject of retirementincomes.
Nathan has assisted many funds with implementation of the retirement income covenant, member outcomes, DDO, members best financial interests duty and Trustee indemnity capital requirements in recent years.
Nathan is actively involved in assisting superannuation industry clients with strategic advice, mergers, administration and outsourcing arrangements, financial advice and policy work.
Nathan is a qualified Actuary (FIAA, CERA) and holds an MBA from Macquarie Graduate School of Management.
Nathan is actively involved in public policy work and sits on the Actuaries Institute Public Policy Council Committee. Nathan also undertook asix-month secondment to Department of Treasury, Canberra in 2018 and was seconded again to assist with the Retirement Income Review.
He is the author of several papers on issues in retirement incomes including ‘What is the right level of Superannuation Guarantee?’ presented to the Actuaries Summit in 2019.

Chief Executive Officer, ASFA
Mary Delahunty is the Chief Executive Officer of the Association of Superannuation Funds of Australia Limited (ASFA).
ASFA is the peak policy, research and advocacy body for Australia’s superannuation industry. It is a not-for-profit, sector-neutral, and non-party political, national organisation. ASFA’s mission is to continuously improve the superannuation system, so all Australians can enjoy a dignified retirement.
Mary joined ASFA in 2024 after founding Seven Advisory, a specialist ESG and impact advisory service to institutional investors developing their social license to deliver long-term value. Prior to that Mary was Head of Impact at HESTA where she played a key role in shaping strategic policies and responsible investment practices to advance member outcomes in the superannuation system. She was also previously an executive with Link Market Services.
Mary is a member of the Pensions & Investment World Pension Summit International Advisory Board and holds several board positions including in the RegTech and education sectors and was a 2015 Churchill Fellow awarded for international research on gender equity in retirement outcomes.
Mary studied Arts at the University of Melbourne, and later completed a Graduate Diploma of Financial Planning and then a Masters of Applied Finance.

Marketing Manager - Brand & Content, Rest
As a Brand and Content Manager, Sinem has built her career working across brand campaigns, social media strategy and cross-channel storytelling.
Working at the intersection of technology and creative innovation, she’s crafted her skill of turning complex brand concepts into engaging social narratives that connect and resonate with member experiences.
Specialising in superannuation, she’s passionate about exploring how brand storytelling through social media can converge to drive meaningful audience connection.

Chief Risk Officer, Rest
Gemma was appointed as Chief Risk Officer in November 2018 and leads the Enterprise Risk function which includes investment risk, operational risk, business resilience, financial crime, compliance and regulatory engagement.
Gemma has over 25 years’ experience in risk management and governance across multiple industries including government, engineering and financial services. She is known for her ability to drive organisational change and achieve business objectives in complex and dynamic environments. Prior to joining Rest, Gemma held senior positions at MLC Life Insurance, MLC Wealth, Parsons Brinkerhoff and Federal Treasury. She is a Director on the Board of the Fund Executives Association Limited. Gemma holds a Master of Arts from the Australian National University, a Bachelor of Economics, Social Science (First Class Honours) from the University of Sydney and is a graduate of the Australian Institute of Company Directors.

Director, Partnership Program, QLD and NT, Australian Signals Directorate (ASD)
Adrian C works in the Australian Signals Directorate and is the Director of ASD’s Cyber Security Partnership Program.
He has worked in various roles in the National Intelligence Community for the last 16 years including geospatial intelligence, intelligence support to Australian Defence Force Military Operations and writing core components of the Comprehensive Review – legal framework of the National Intelligence Community.
Adrian transferred to Australian Signals Directorate in 2021 and was responsible for the section that develops and publishes ASD’s technical publications and guidelines.
He moved from Canberra to Brisbane in January 2023 to commence his current role within Australian Signals Directorate.

Chief Executive Officer, Brighter Super
Kate Farrar is the Chief Executive Officer of Brighter Super, where she has led the fund’s transformation from a $10 billion Queensland public-sector fund into a $35 billion success story with more than 280,000 members.
Since her appointment as CEO in April 2018, Kate has overseen the merger of LGIAsuper and Energy Super and the acquisition of Suncorp Super—the first industry fund acquisition of a retail fund. This integration, completed 18 months ahead of schedule, delivered a 40% reduction in administration fees for members while expanding services across Queensland.
Under Kate’s leadership, Brighter Super has become one of the fastest-growing industry funds in Australia, recognised for both its operational sustainability and member-first approach. In acknowledgment of these achievements, she was awarded the Fund Executive of the Year Award by the Fund Executives Association Ltd (FEAL) in 2024.
Kate brings 35 years of leadership experience across finance and energy, including senior roles at Barclays de Zoete Wedd, Suncorp Investment Management, NSW Treasury Corporation, McKinsey & Company, and Ergon Energy.
Beyond her role at Brighter Super, Kate serves as a Non-Executive Director of ASX100-listed Seven Group Holdings and is the President of the Queensland Futures Institute.
She holds a Bachelor of Music (Honours) and a Master’s Degree in Econometrics and Finance. Through a scholarship from Chief Executive Women, she is also a graduate of INSEAD’s Advanced Management Programme. In 2025, following her FEAL award education grant, Kate completed the Stanford Graduate School of Business program, People, Culture, and Performance: Strategies from Silicon Valley.

Assistant Secretary, ACTU
As ACTU Assistant Secretary, Joseph is passionate about winning a better future for working people and growing the union movement.
Joseph has a Bachelor of Economics and Bachelor of Arts from Australian National University and a Graduate Certificate in Applied Finance from the University of NSW.
Joseph Mitchell is a trustee director of TelstraSuper.

Group Chief Executive Officer, Team Super
The Team Superannuation Fund (Team Super) is a profit-to-members, public offer pension fund dedicated to serving the retirement needs of all Australians. Team Super manages over $22 billion in funds for approximately 150,000 members.
Vasyl Nair is the Chief Executive Officer of Team Super (prior to this, Vasyl held the roles of Deputy Chief Executive Officer, Chief Risk Officer and Chief Strategy Officer).
Vasyl is a keen advocate for the ongoing development of the superannuation sector, with active participation in a number of different parts of the industry. He has served as a director of an Australian fintech organisation, specialising in superannuation and investment administration.
Vasyl was appointed to the Board of the Association of Superannuation Funds of Australia (ASFA) as Director in January 2025, the peak pension fund association in Australia.
Vasyl has a strong background in law, corporate finance and strategy, having held senior roles across at some of Australia’s largest financial services institutions. Vasyl holds a Bachelor of Laws (Hon), Bachelor of Commerce, Graduate Diploma of Legal Practice and an Executive Master of Business Administration. He is admitted to the Supreme Court of NSW as a solicitor, is a Graduate of the Australian Institute of Company Directors and has achieved a Certificate of Business Excellence from the Haas School of Business, U.C.
Berkeley.

Chief Executive Officer, Cbus Super
Kristian Fok is the CEO of Cbus Super, Australia’s leading specialist superannuation fund for the building and construction sector. Cbus was founded 40 years ago and provides superannuation and income streams to more than 925,000 members and manages over $105 billion of members’ money (as of 30 June 2025). He is responsible for all aspects of Cbus and reports directly to the Board.
Prior to his appointment in June 2023, Kristian Fok served as the Fund’s Chief Investment Officer (CIO) for 10 years. Cbus is a significant, long-term investor in the Australian economy and the Fund invests back into our members’ industries both directly and indirectly and via unique vehicles such as our wholly owned entity, Cbus Property.
As CIO, Kristian was responsible for leading the Cbus investment strategy, this included evaluating opportunities that provide returns to members over the long term, managing investment governance and risk and monitoring the portfolio. Kristian led the development and implementation of Cbus’ hybrid internalisation strategy, which has proven successful in driving strong returns and delivering total cumulative fee and costs savings for members of over $730 million.
Kristian is Chair of the Australian Sustainable Finance Institute (ASFI) and serves on the Board of the Australian Council of Superannuation Investors (ACSI). Kristian’s qualifications include Bachelor of Commerce, Fellow of the Institute of Actuaries Australia and Fellow of FINSIA.

General Manager, Market Strategy & Propositions, Novigi
Kevin has long played a central role in shaping and driving strategic initiatives across the superannuation and wealth management sectors. With deep expertise in data strategy and a passion for AI, Kevin leads the development of forward-thinking solutions – ranging from strategic partnerships to managed services – that address evolving client needs.
A recognised thought leader, Kevin is known for leveraging data-driven insights to deliver sustainable value. His leadership is central to Novigi’s market positioning, helping to define the company’s growth strategy in an increasingly complex and dynamic financial landscape.

Chief Executive Officer, Rest
Vicki joined Rest as Chief Executive Officer in May 2018, bringing more than 20 years of
senior executive leadership experience in superannuation, life insurance, wealth management and banking.
Vicki’s experience includes executive leadership roles at some of Australia’s largest financial services organisations. She has an extensive background in distribution, strategic marketing, digital, fund operations and contact centres, customer strategy and design and product management.
Vicki is passionate about simplifying and demystifying superannuation to help all Australians achieve their best retirement outcomes.
Vicki holds an Executive MBA from the Australian Graduate School of Management and a diploma from the Australian Institute of Company Directors. Vicki has been a Non-executive Director of the Australian Council of Superannuation Investors since 2018 and a Director of The Association of Superannuation Funds of Australia since 2022.
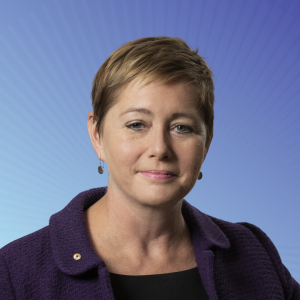
Chief Executive Officer, Australian Council of Superannuation Investors (ACSI)
Louise Davidson has spent her career with a focus on building long-term value for the millions of beneficiaries of Australian superannuation funds. Most recently this has included elevating the importance of environmental, social and governance factors in managing material financial risk in super fund investment portfolios.
As CEO of the Australian Council of Superannuation Investors (ACSI) since 2015, Louise oversees ACSI’s program of company engagement, research and policy advocacy, backed by 30 years of senior experience in the financial services and ESG sectors. Her tenure as ACSI CEO has seen significant improvements in the way listed companies manage important issues including boardroom diversity, climate risk and human rights.
Prior to being appointed ACSI CEO, she was Investment Manager, ESG at Cbus superannuation fund.
Louise is the co-founder of the Mother’s Day Classic, which has raised over $50 million for breast and ovarian cancer research since 1998. She was appointed a Member of the Order of Australia in 2019 for her significant service to the superannuation sector and to breast cancer research.
She is a director of Chief Executive Women, a deputy chair of the Client Advisory Board of EOS at Federated Hermes, and a former director of the Peter MacCallum Cancer Centre and the International Integrated Reporting Initiative and former chair and director of the Mother’s Day Classic Foundation.
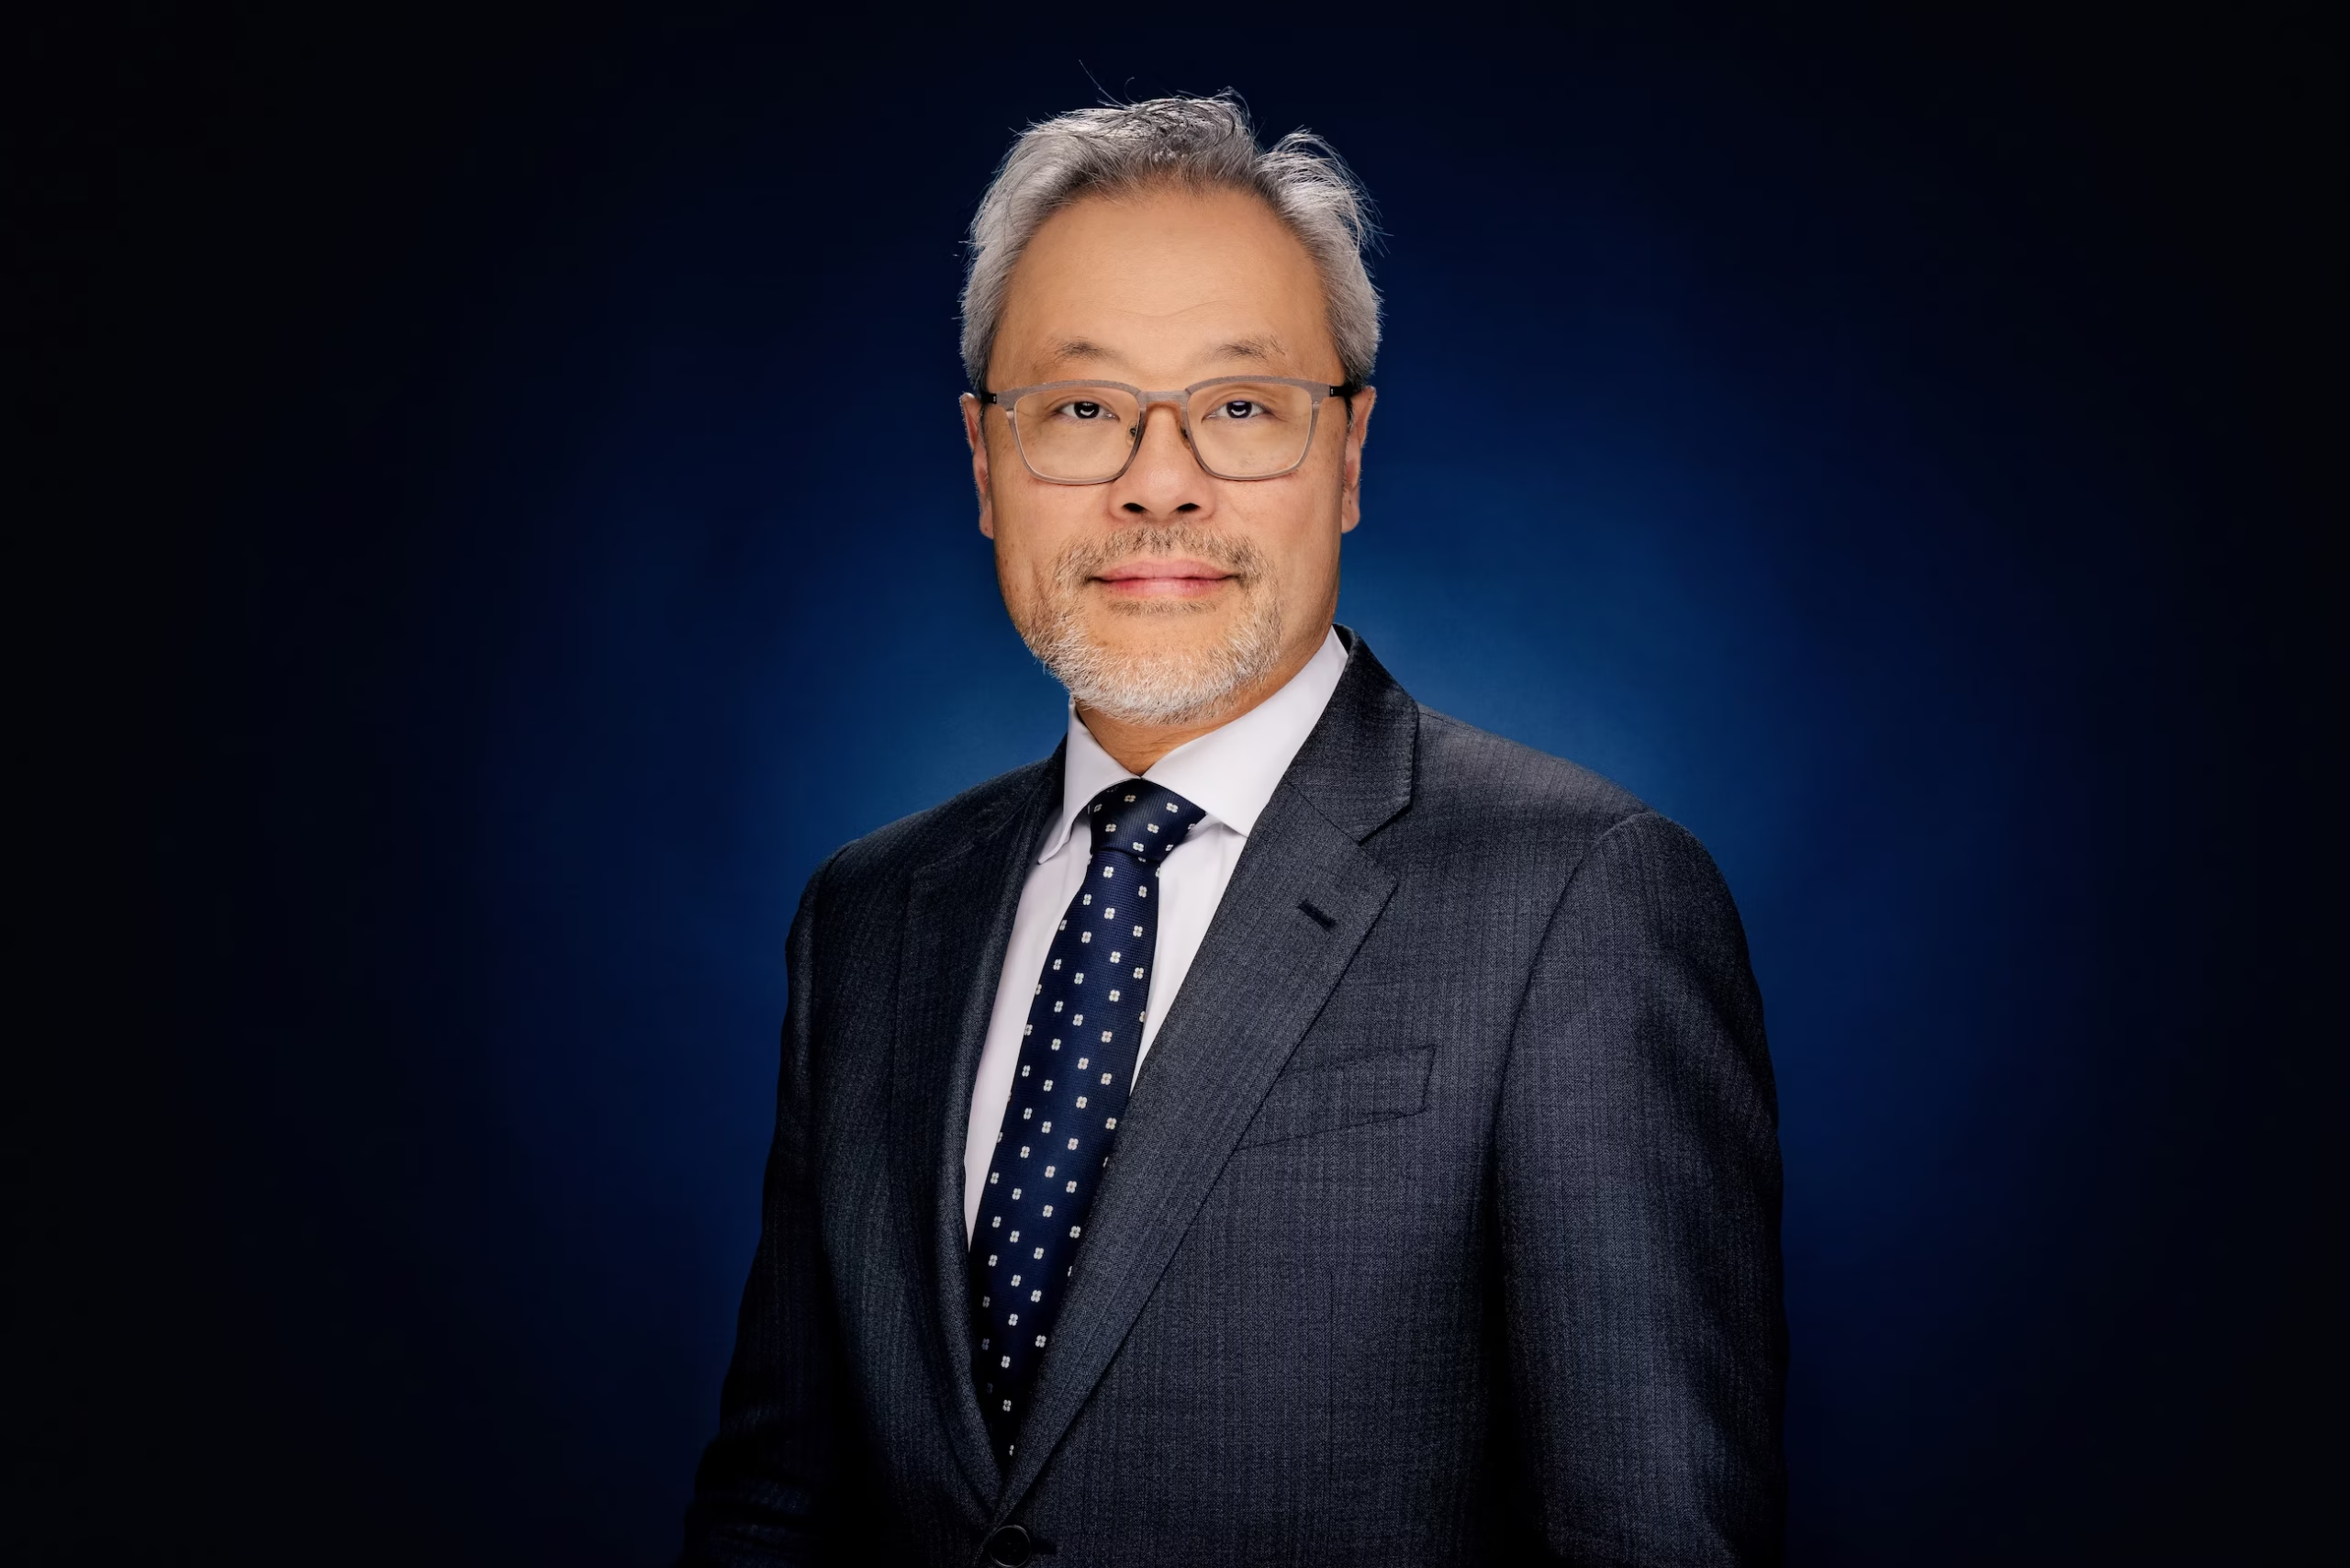
Chief Executive Officer, UniSuper
Peter Chun joined UniSuper as the Chief Executive Officer in September 2021, bringing more than 30 years’ experience in financial services.
UniSuper is one of Australia’s largest super funds with more than 700,000 members and over $158 billion in funds under management (as at 30 June 2025).
As CEO, Peter is responsible for developing, leading, and implementing corporate strategy and culture. He is also accountable for the overall services and operational management of UniSuper Management nationally.
Prior to joining UniSuper, Peter held senior executive roles at Aware Super, Colonial First State and Credit Suisse.
Peter is a qualified Actuary with a Bachelor of Economics from Macquarie University. He holds Graduate Diplomas in Applied Finance and Investments and Financial Planning from the Securities Institute of Australia; and has undertaken the Advanced Management Program at Harvard Business School (Boston, USA). Peter is a Director of UniSuper Management Pty Ltd and Diversity Council Australia.
Peter is a Director of Diversity Council Australia, a Member of the ASFA CEO Advisory Committee and the Australian Chamber Orchestra Finance Audit & Risk Committee.

Head of Financial Crimes, MUFG Retirement Solutions
Eoin Burke is the Head of Financial Crimes, MUFG Retirement Solutions, a division of MUFG Pension & Market Services (MPMS), with over 20 years of experience in financial crime prevention, compliance, and data analytics.
He has held senior leadership roles across APAC and EMEA, and plays a critical role in protecting the organisation from financial threats, responsible for safeguarding the data and monetary assets of over 20 million accounts. His remit includes fraud and scam prevention, AML/CTF compliance and reporting, regulator and law enforcement engagement, training and awareness, and driving innovation in protective technologies. He also developed ‘ALERT’, MPMS’s internal fraud analytics capability, which now protects over 10.5 million member accounts daily and has prevented more than $150 million in financial crime.
A recognised industry leader, Eoin regularly speaks at major forums including the Financial Crimes and Cyber Security Forum and the AUSTRAC Symposium, sharing insights on emerging risks and best practices in financial crime prevention. His strategic direction continues to strengthen MPMS’s defences and reinforce its commitment to integrity and security.
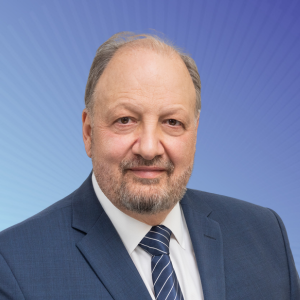
Chief Executive Officer, State Super
Mr Livanas leads a team of experienced senior executives in managing the provision of member services and the investment of approximately $38 billion of assets (as at 30 June 2025).
Mr Livanas has over 30 years’ industry experience, having worked in organisations including Deloitte South Africa, the South African Government Employees Pension Fund – the precursor to the country’s sovereign fund – and several Australian superannuation funds.
Prior to his appointment in October 2011, Mr Livanas was the Chief Executive Officer of AMIST Super (2008–11) and the General Manager of FuturePlus Financial Services (2002–08). He was a Director of ISPT and ISPT Grosvenor International Property Trust from 2010–12 and in August 2013 was appointed to the Board of the Australian Council of Superannuation Investors.
Mr Livanas holds a Bachelor of Science in Engineering and an MBA from the University of Witwatersrand and a Graduate Diploma of Finance and Investments from the Financial Services Institute of Australia. He is an ASFA-accredited Investment Fiduciary and a Graduate of the Australian Institute of Company Directors.

Chief Executive Officer, HESTA
Debby Blakey, GAICD, is the CEO of HESTA, Australia’s $96 billion superannuation fund for health and community services workers. With over 30 years’ experience in the superannuation and financial services sectors, she holds qualifications in Mathematics, Computer Science, Financial Advice, Governance, Pension Fund Design and Sustainability.
Debby’s leadership is characterised by a ‘people-first’ approach, focusing on enhancing member experiences and financial outcomes while also ensuring operational rigour and excellence. She is a strong advocate for innovation and transformation within the superannuation industry.
Debby is the President of the Australian Council of Superannuation Investors (ACSI), a Director of the International Corporate Governance Network (ICGN) and is the founding Chair of the 40:40 Vision initiative – promoting gender equality at executive and Board level in ASX300 companies.
Under Debby’s leadership, HESTA has been called the ‘corporate conscience of Australia’ for its commitment to strong governance, environmental management and gender equality.

Chair, IFM Investors
Cath is the Chair of IFM Investors; Industry Super Holdings (ISH); and the Federal Government’s Jobs & Skills Ministerial Advisory Board.
She is a Director of Industry Fund Services (IFS) and of the Melbourne Arts Precinct Corporation.
Cath has worked for many years in senior roles in both the superannuation industry and union movement. She was the Chief Executive of IFS and Chief Executive of the Australian Government Employees Superannuation Trust (AGEST) from 2010 until its merger with AustralianSuper in 2013.
Prior to this, Cath was a Senior Industrial Officer at the Australian Council of Trade Unions (ACTU). She has held a number of directorships and committee positions throughout her career, including Director of AustralianSuper, Director of AGEST Super and Director of Ausgrid.

Chief Executive Officer, NGS Super
Natalie is the Chief Executive Officer of NGS Super.
With a career grounded in governance, legal, and strategic leadership, Natalie brings a forward-thinking and purpose driven approach to superannuation. She is responsible for steering the fund through a dynamic regulatory landscape, ensuring operational excellence, and delivering long-term value to members.
Natalie also served as Chief Risk and Governance officer having deep institutional knowledge and a strong track record in executive oversight and regulatory engagement.
She is known for her collaborative leadership style and her ability to drive transformation while maintaining a strong member-first ethos.
Prior to joining NGS in 2019 Natalie held senior governance roles at AMP, Suncorp and Perpetual.

Director, Resilience & Cyber, UK Finance
Laura Catterick is the Director of Resilience & Cyber at UK Finance, which is the collective voice for the UK banking and finance industry, representing over 300 firms and supporting members in their efforts to build more resilient firms and a more resilient financial sector.
Within UK Finance, Laura works closely with industry leaders, government, and regulators, influencing policy on operational resilience and cybersecurity at a national level. UK Finance also co-chairs CMORG (Cross Market Operational Resilience Group) to deliver collaborative resilience initiatives that address systemic risks.
Laura is a Chartered Professional Accountant from Canada with extensive experience in risk, regulatory compliance, cyber security, operational resilience, and large-scale transformation. She has held senior executive roles within highly regulated sectors, including roles across all three lines of defence within Deloitte, PricewaterhouseCoopers, Lloyds Banking Group, and Mastercard.

Chief Operating Officer, SS&C Technologies
Josh Cross brings over 30 years of experience in Technology, Operations, Delivery and Transformation within the Australian Financial Services industry. His expertise spans Trade Finance, Institutional and Corporate Lending, Consumer Lending, Share Trading, Insurance and Superannuation.
Josh joined SS&C in July 2025 through a lift-out from Insignia Financial – one of Australia’s largest Superannuation and Investment providers, known for its growth through large-scale acquisitions and technology separations from major Australian banks.
In his current role, Josh leads the SS&C Business Process Outsourcing (BPO) function, which delivers technology, operations, and service delivery for more than one million Australian across multiple technology eco-systems, supported by a team of approximately 1300 staff. Over the next three years, Josh will also lead the major transformation of the underlying superannuation platforms and processes, migrating to SS&C’s Bluedoor ecosystem.
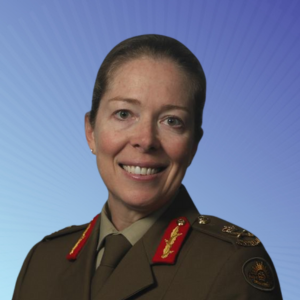
National Cyber Security Coordinator, Department of Home Affairs
Lieutenant General Michelle McGuinness, CSC was appointed as Australia’s National Cyber Security Coordinator (the Coordinator) on 26 February 2024.
As the Coordinator, LTGEN McGuinness leads national cyber security policy, the coordination of responses to major cyber incidents, whole of government cyber incident preparedness efforts, and the strengthening of Commonwealth cyber security capability.
LTGEN McGuinness has served in the Australian Defence Force for 30 years in a range of tactical, operational, and strategic roles in Australia and internationally.
Prior to this appointment, LTGEN McGuinness most recently served as Deputy Director Commonwealth Integration in the United States Defense Intelligence Agency. In this role, she led policy and cultural reform, and technological integration, including interoperability across information technology, systems and data.

Head of FX and Derivative Sales, NAB
Jamie is NAB’s Global Head of FX and Derivative Sales. Jamie is responsible for several Markets related sales businesses including NAB’s Institutional, Corporate and Government teams. Prior to joining NAB, Jamie spent 17 years in London working as a Managing Director for a US Investment Bank in their Global Markets division running sales and trading businesses for both the Interest Rate and FX product.
Jamie holds a Bachelor of Economics Degree from The University of Sydney and is based in Sydney.

Deputy CEO, Regulation, AUSTRAC
Katie Miller is the Deputy CEO, Regulation, AUSTRAC and has strategic responsibility for AUSTRAC’s regulatory, policy and legal functions.
Katie has extensive experience exercising regulatory functions and advising regulators at state and federal levels. Katie is a published author on issues involving regulation, law and technology and supports connections between government, practitioners, communities of practice and academia.

Best Selling Author, Podcast Host of 'Plain English'
Via live link
Few speakers can match Derek Thompson‘s ability to synthesize mega-trends in society, labor, economics, technology, and politics. Put another way: Derek trawls the data sets and does the forecasting and deep reporting necessary to help us better understand how we live, how we vote, how we spend, and how we work.
In his paradigm-shifting #1 New York Times bestseller, Abundance (co-written with Ezra Klein), this award-winning journalist reveals how our policies and culture have pushed us into a world of scarcity (not enough housing, workers, or progress)—and offers a radical new path towards a world where housing is affordable, energy is plentiful, and innovation flourishes across industries.
He shares a compelling vision of a future where we have more than enough for everybody, and a practical, actionable roadmap for how to get there. It starts with taking more risks, building more expansively, and recognizing that we all have the power to create a world of abundance. “Everything’s utopian until it’s reality,” he says.

Executive Director - Superannuation, Life & Private Health Insurance, APRA
Carmen joined APRA in March 2023 and holds the role of Executive Director, Life and Private Health Insurance and Superannuation.
She has had an esteemed career in financial services, spanning over 25 years. She has held diverse leadership roles at Westpac and Commonwealth Bank of Australia, including across risk, transformation and change, product and portfolio development, and sales and service.
Prior to joining APRA, she held the role of General Manager, Risk Transformation Delivery Integration at Westpac. This involved leading the group-wide implementation of a suite of solutions to uplift risk management capability and develop data, analytics and reporting.
Carmen leads with a values-driven approach and a particular interest in developing and mentoring talent.
She holds a Bachelor of Commerce and Accounting, is a certified Chartered Accountant and a Graduate of the Australian Institute of Company Directors.
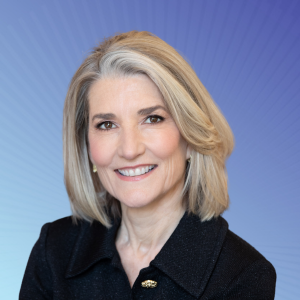
Novartis Professor of Leadership and Management, Harvard Business School
Amy C. Edmondson is the Novartis Professor of Leadership and Management at the Harvard Business School, a chair established to support the study of human interactions that lead to the creation of successful enterprises that contribute to the betterment of society.
Edmondson has been recognized by the biannual Thinkers50 global ranking of management thinkers since 2011, and most recently was ranked #1 in 2021 and 2023; she also received that organization’s Breakthrough Idea Award in 2019, and Talent Award in 2017. She studies teaming, psychological safety, and organisational learning, and her articles have been published in numerous academic and management outlets, including Administrative Science Quarterly, Academy of Management Journal, Harvard Business Review and California Management Review. Her 2019 book, The Fearless Organization: Creating Psychological Safety in the Workplace for Learning, Innovation and Growth (Wiley), has been translated into 15 languages. Her prior books – Teaming: How organizations learn, innovate and compete in the knowledge economy (Jossey-Bass, 2012), Teaming to Innovate (Jossey-Bass, 2013) and Extreme Teaming (Emerald, 2017) – explore teamwork in dynamic organisational environments. In Building the future: Big teaming for audacious innovation (Berrett-Koehler, 2016), she examines the challenges and opportunities of teaming across industries to build smart cities.
Edmondson’s latest book, Right Kind of Wrong (Atria), builds on her prior work on psychological safety and teaming to provide a framework for thinking about, discussing, and practicing the science of failing well. First published in the US and the UK in September, 2023, the book is due to be translated into 24 additional languages, and was selected for the Financial Times and Schroders Best Business Book of the Year award.
Before her academic career, she was Director of Research at Pecos River Learning Centers, where she worked on transformational change in large companies. In the early 1980s, she worked as Chief Engineer for architect/inventor Buckminster Fuller, and her book A Fuller Explanation: The Synergetic Geometry of R. Buckminster Fuller (Birkauser Boston, 1987) clarifies Fuller’s mathematical contributions for a non-technical audience. Edmondson received her PhD in organisational behavior, AM in psychology, and AB in engineering and design from Harvard University.

Assistant Treasurer and Minister for Financial Services
Born in Brindisi, Italy, Daniel was a young child when he moved with his family to Australia. He grew up in Canberra and completed his first degrees – arts and law – at the ANU. He then completed a Master of Economics (University of Sydney) and a PhD in economics from Yale.
He lectured at Monash University, was an economic adviser in the Gillard government and was a Victorian MP from 2014 to 2018. As Parliamentary Secretary to the Treasurer of Victoria, Daniel helped deliver major infrastructure projects and developed innovative financing structures for community projects.
In 2018 he was preselected for the new federal seat of Fraser and became its first MP at the 2019 election, re-elected in 2022 and 2025. From 2022 to 2025, Daniel was chair of the House of Representatives’ Standing Economics Committee in which he chaired inquiries; economic dynamism, competition and business formation and insurers’ responses to 2022 major floods claims.
In 2025, he became the Assistant Treasurer and Minister for Financial Services.
In August 2022, Daniel published ‘Safety Net: The Future of Welfare in Australia’, which aims to explore the ways in which an insurance approach can improve the effectiveness of government service delivery.